Power BI Business Report Template: Analyze Revenue, Production, and Costs
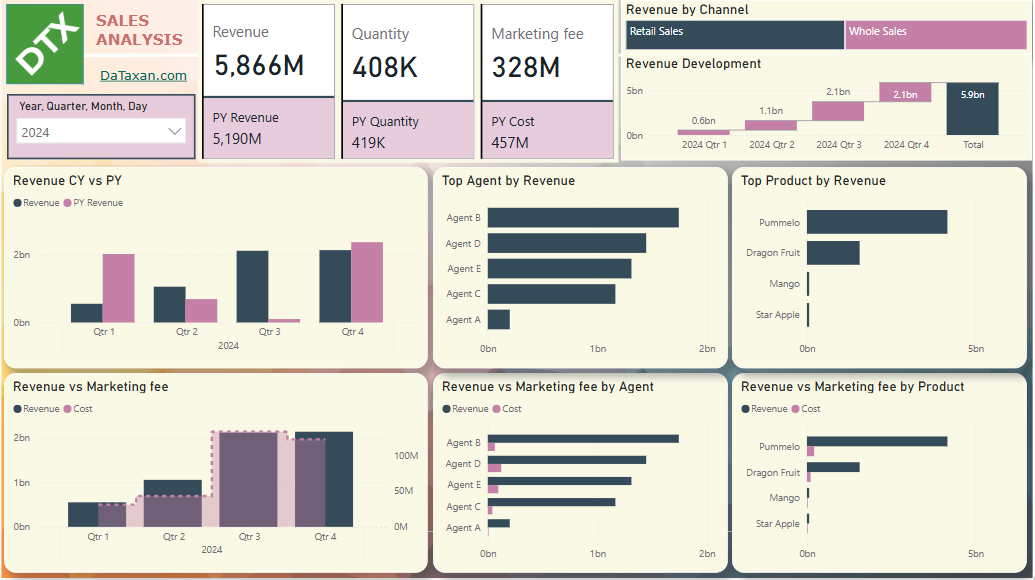
Gain actionable insights into your business performance with our Power BI Business Report Template, designed to provide a clear overview of revenue, production, and costs over one or multiple periods.
Track Revenue and Costs with Ease
This report allows businesses to:
- Monitor revenue and cost fluctuations across different periods.
- Compare data with the same period from the previous year to identify trends.
Identify Top Performers
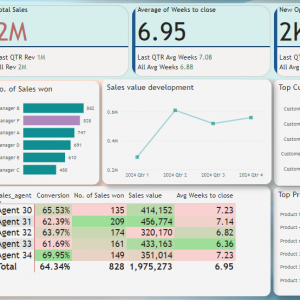
Highlight the agents (employees) or products generating the highest revenue, and compare revenue and costs by agent or product. Use these insights to craft effective business strategies.
In-Depth Analysis Made Simple
Analyze your operations at various levels with visually engaging designs that reveal key differences and reasons behind performance trends. This helps businesses make timely, informed decisions to enhance results.
Flexible and Customizable
Tailor the report to your needs:
- Adjust comparison years or data categories effortlessly.
- Replace fields like marketing costs with others (e.g., cost of goods sold, shipping costs, or discounts) to suit your business structure.
Easy Setup
Built using raw Excel data, the Power BI report is simple to deploy—just update the sample Excel file with your data, and it’s ready to go!
Customizable and Flexible Reporting
This Power BI report is designed based on raw Excel data. If you have specific data formats or dashboard needs, report Customization is available and at discount price. Email us at contact@dataxan.com for more details
NOTE: Upon payment, Please download file immediately from Order received confirmation screen on our website. Otherwise, Download link sent to your mail may not work properly. Should you need any support, please feel free to email us: contact@dataxan.com
Purchase condition:
The template is for Private Use Only (not for distribution or resale)
The template may NOT be sold, distributed, published to an online gallery, hosted on a website, or placed on any server in a way that makes it available to the general public.

Reviews
There are no reviews yet.