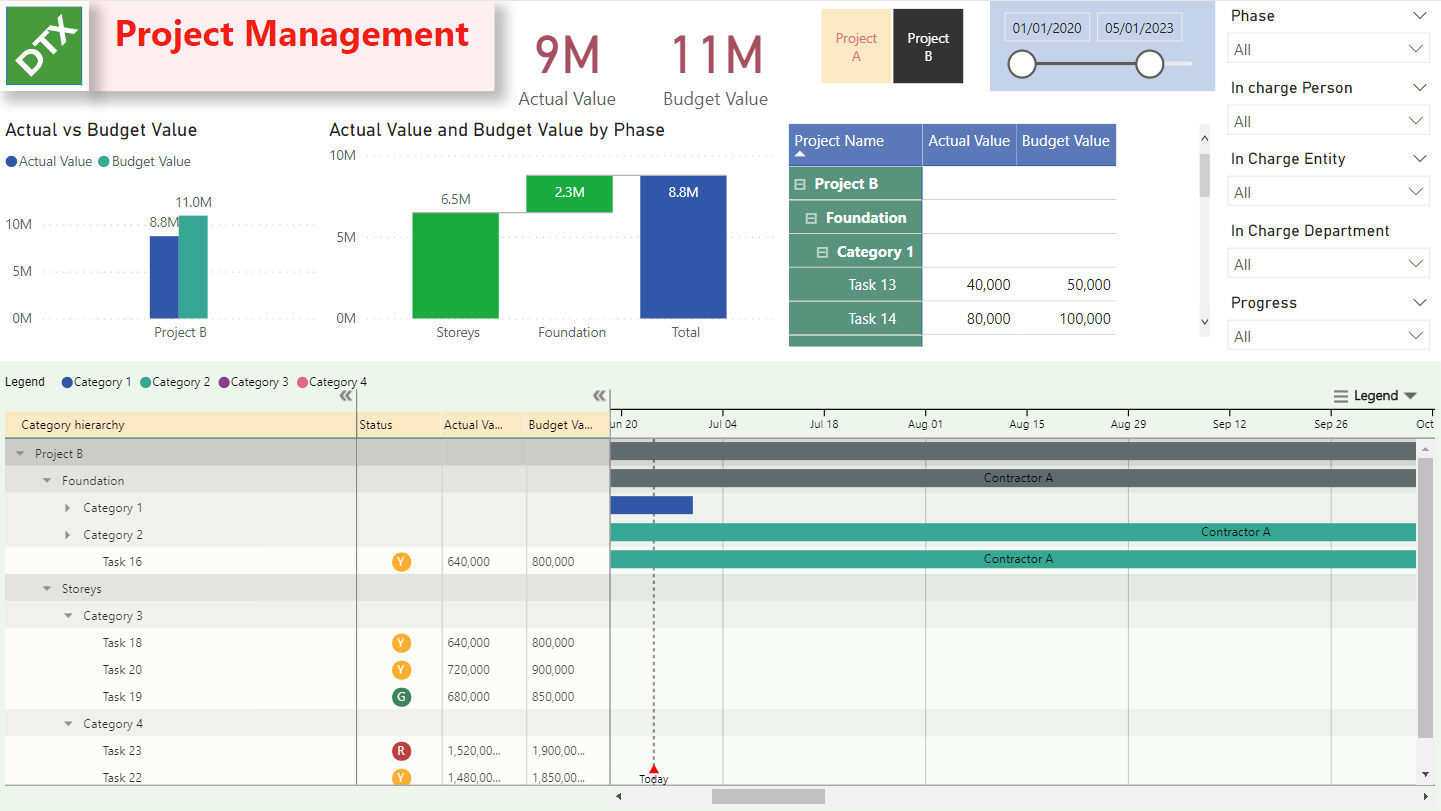
This report helps businesses manage projects smart.
The Gantt Chart and super interactive features of Power BI make it easy for businesses to track the project progress at different levels, customized timeline by week, month, quarter or year.
Report Customization is available and at discount price. Email us at contact@dataxan.com for more details
NOTE: Upon payment, Please download file immediately from Order received confirmation screen on our website. Otherwise, Download link sent to your mail may not work properly. Should you need any support, please feel free to email us: contact@dataxan.com
Purchase condition:
The template is for Private Use Only (not for distribution or resale)
The template may NOT be sold, distributed, published to an online gallery, hosted on a website, or placed on any server in a way that makes it available to the general public.
Reviews
There are no reviews yet.