Stock Analysis with Power BI – Sell in May!
With Power BI, you can quickly analyse stock trend, forecast stock indexes at ease.
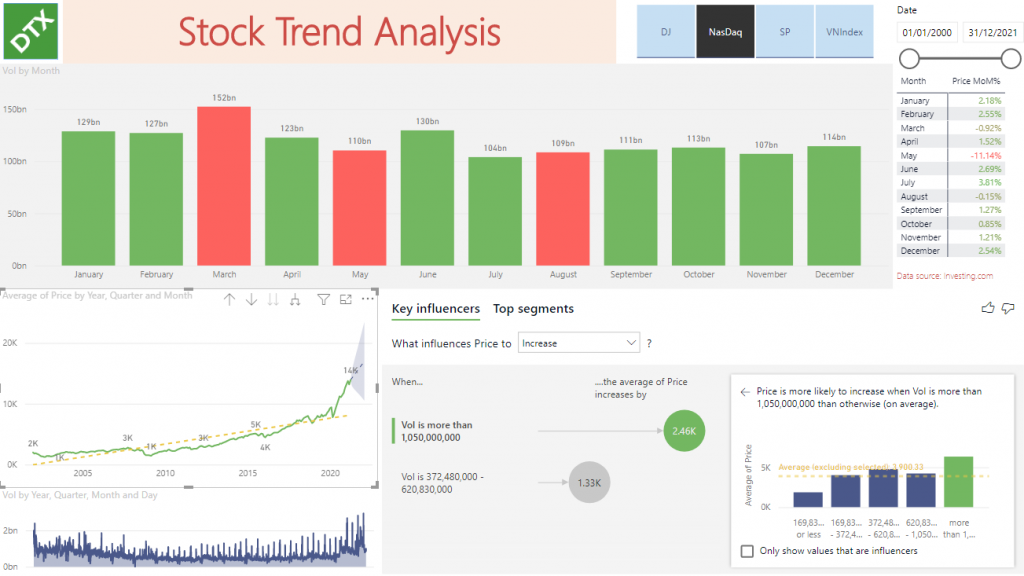
In this sample Power BI report, DaTaxan analyse performance of key US stock indexes like S&P 500, Dow Jones, Nasdaq and VNIndex (for Vietnam stock market) in each month to understand the investment adage “Sell in May and go away“.
In accordance to Investopedia, investors should divest their stock holdings in May and wait to reinvest in November. From 1950 to around 2013, the Dow Jones Industrial Average posted lower returns during the May to October period, compared with the November to April period. Let’s do the analysis in Power BI with us now!
DaTaxan also analyses Key factors impacting stock prices. AI powered Key Influencers from Power BI suggests that transaction volume has strong correlation with stock prices.
Why not Follow our Youtube Channel, Facebook page and subscribe to DaTaxan page to get more the Power BI tips!
What is Power BI?
Power BI is a business analytics service by Microsoft. It enables users to easily create reports, collaborate on dashboards, and share insights—inside and outside organization—with user-friendly tools, interactive visualizations and business intelligence capabilities.
Power BI Templates
Power BI templates are amazing as starter reports.
Our Power BI templates provide you with ideas for a standardized layout, visualization settings, DAX Measures and color theme, and you are ready to go with the valuable insights for your businesses.
Should you need any supports regarding Power BI, feel free to reach out to us at contact@dataxan.com
